Vector Automated Warehouse Graphic
If you’ve ever searched for a clean, professional image to explain how a smart warehouse works, you already know the struggle. Most graphics look like they were designed in 2009, generic conveyor belts, stick-figure workers, and color palettes that belong on a clip art disc. But vector automated warehouse graphics have become something much more powerful than decorative filler. They’re communication tools, pitch deck heroes, and educational assets rolled into one scalable file.
As someone who has worked with logistics clients on visual branding and technical documentation for over a decade, I’ve watched these graphics evolve from simple illustrations into rich, data-driven visuals that explain entire supply chain systems at a glance. Here’s what you actually need to know.
What Is a Vector Automated Warehouse Graphic?
A vector automated warehouse graphic is a scalable digital illustration depicting robotic, automated, or AI-driven warehouse environments, created using mathematical paths rather than pixels. Because it uses vector format (typically SVG, EPS, or AI files), the image scales to any size, from a business card to a billboard, without losing sharpness or quality.
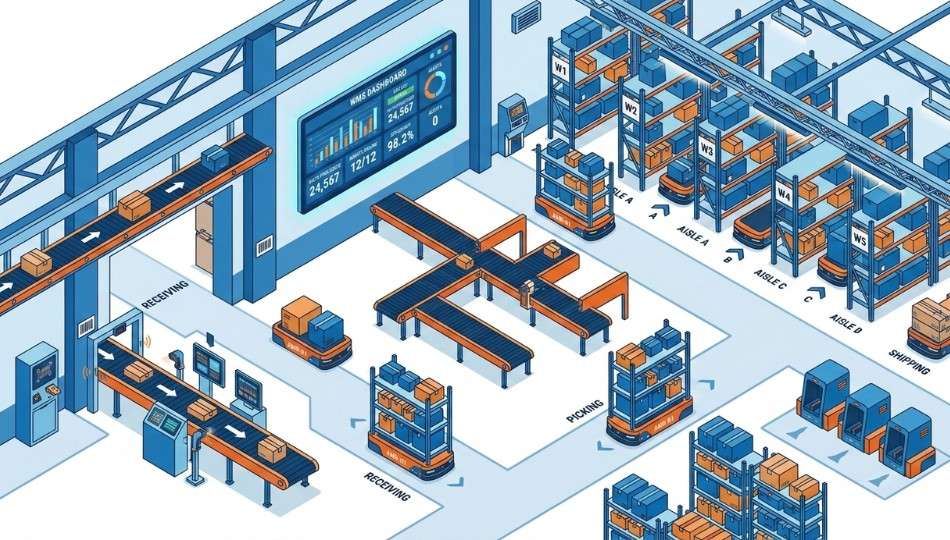
These graphics typically include elements like autonomous mobile robots (AMRs), conveyor systems, vertical storage racks, barcode scanners, and warehouse management system (WMS) dashboards. According to a 2024 report by MHI (the Material Handling Institute), over 74% of supply chain companies plan to invest in automation visualization tools for internal communications, training, and investor presentations by 2026.
That’s not a small number. That’s a structural shift in how the logistics industry explains itself.
Why Automated Warehouse Visuals Matter More Than Ever
The global warehouse automation market was valued at $23.4 billion in 2023 and is projected to reach $41 billion by 2028, according to MarketsandMarkets research. But here’s the kicker: most companies still struggle to explain what their automation actually does to non-technical stakeholders.
A well-designed vector automated warehouse graphic bridges that gap instantly.
Think about a CFO reviewing a capital expenditure proposal for a robotic picking system. Dense paragraphs of technical specs? Ignored. A clean isometric vector showing how a goods-to-person (GTP) system reduces picker travel distance by 65%? That gets the budget approved.
The visual language of warehouse automation has changed dramatically since 2020. Pre-pandemic graphics focused on scale, huge facilities, rows of shelving, forklifts. Post-2022 illustrations lean into precision: robotic arms, AI routing paths, real-time inventory dashboards overlaid on facility floor plans. The shift reflects how automation itself has shifted, away from brute-force storage and toward intelligent movement.
Dr. Mahender Singh, Director of the MIT Center for Transportation and Logistics, has noted in industry panels that “visualization of complex logistics systems is no longer optional for change management, it’s foundational to adoption.” (Source: MIT CTL Industry Symposium, 2024.)
How to Use Vector Automated Warehouse Graphics Effectively
Not all use cases are equal. Here’s a practical framework I call the “4-Layer Visual System” for deploying these graphics strategically.
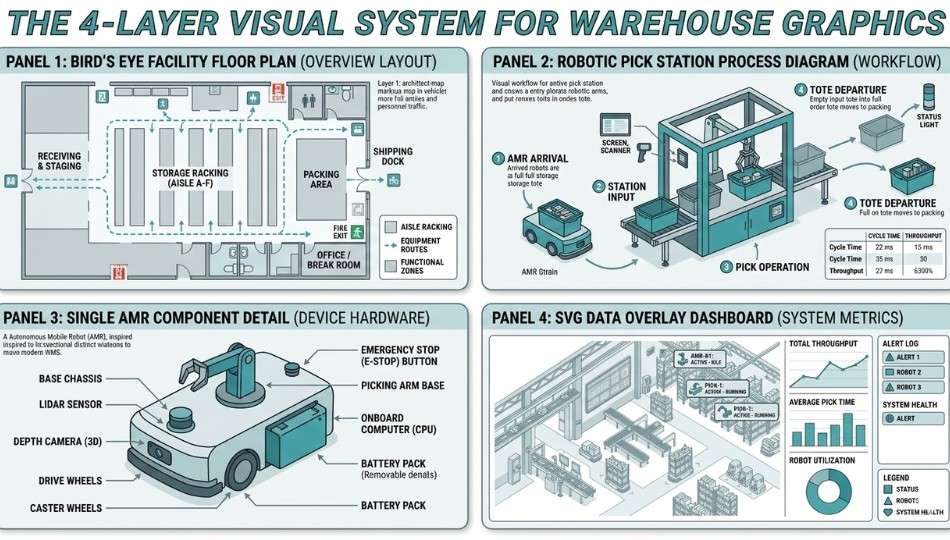
Layer 1: Conceptual Overview (Bird's Eye)
Use wide-angle isometric warehouse floor plan vectors for executive presentations, investor decks, and trade show materials. These show the full picture: inbound docks, sortation systems, dispatch zones. Keep them clean, limit text overlays, and use your brand’s color palette to customize the graphic’s palette.
Layer 2: Process Illustration (Mid-Level)
These graphics zoom into specific workflows. A vector showing a robotic put-wall station or an automated guided vehicle (AGV) path through a pick zone works perfectly for training manuals, standard operating procedure (SOP) documents, and technical proposals. According to the Association for Talent Development, visual process documentation improves learner retention by up to 65% compared to text-only formats.
Layer 3: Component Detail (Close-Up)
Individual element vectors, a single AMR, a barcode reader station, a conveyor belt junction, serve equipment specification sheets, maintenance guides, and product brochures. These work best in EPS format for print applications.
Layer 4: Data-Layer Overlay (Dynamic)
This is where things get genuinely exciting. Modern SVG vector graphics can be coded to accept live data inputs, showing real-time inventory levels, robot positions, or throughput rates. For warehouse management system (WMS) vendors and supply chain software companies, this bridges static graphic and interactive dashboard.
(Yes, this is where I’ve spent most of my time lately, and it’s a genuinely different design challenge than traditional illustration.)
Vector vs. Raster: Why the Format Choice Changes Everything
Here’s a comparison most logistics teams get wrong when sourcing warehouse graphics.
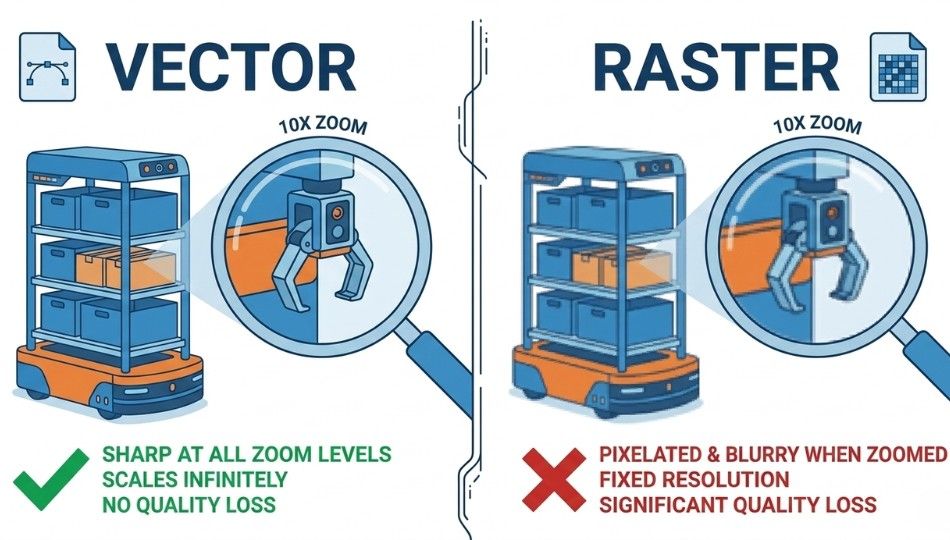
Vector graphics (SVG, EPS, AI):
Resolution-independent, fully editable, small file sizes, ideal for brand-consistent customization. You can change colors, remove elements, add text labels in any language, and scale for any application without quality loss.
Raster graphics (PNG, JPEG, TIFF):
Fixed resolution, locked composition, large file sizes at print quality. Fine for web display at a specific size, problematic for anything else.
The common mistake:
companies buy a high-resolution PNG of a warehouse illustration for $15, use it in a presentation, then try to print it on a trade show banner. The result is a pixelated mess that undermines the professional image they’re trying to project.
A quality vector automated warehouse graphic costs more upfront, typically between $50 and $500 for a licensed commercial asset on platforms like Adobe Stock or Shutterstock, or $200 to $2,000+ for custom commissioned work. But that file serves every application indefinitely. The ROI calculation isn’t complicated.
The research is actually mixed on whether businesses consistently choose the right format. A 2023 survey by the Graphic Artists Guild found that 41% of marketing teams reported purchasing the wrong file format for their use case at least once in the prior year, costing an average of $1,200 in rework and redesign time.
Who Actually Needs These Graphics (And Who Doesn't)
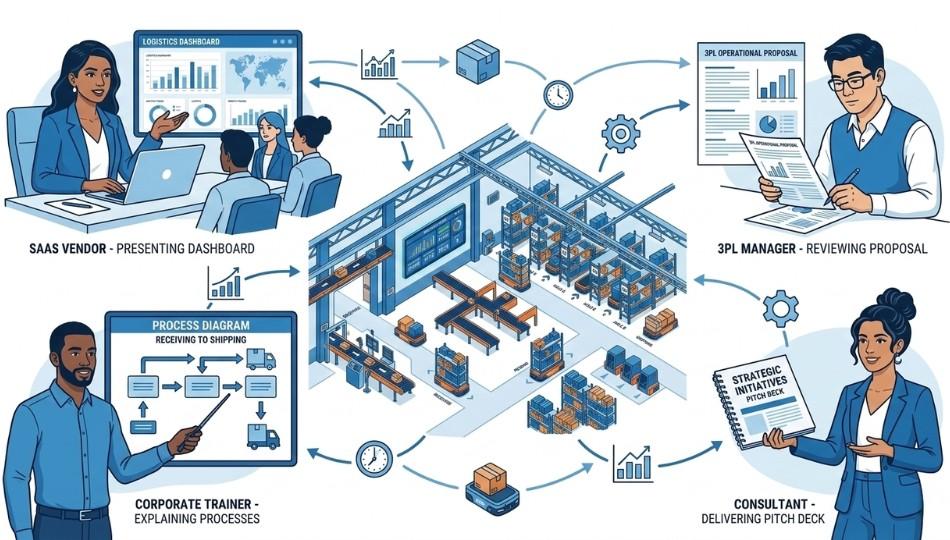
Real-world users of vector automated warehouse graphics fall into pretty distinct groups.
Supply chain technology vendors use them for SaaS product marketing, showing how their WMS, robotics software, or slotting optimization tool integrates within a physical warehouse environment.
Third-party logistics (3PL) providers include them in RFP responses and capability statements to visually differentiate their service offerings.
Corporate training departments in retail, e-commerce, and manufacturing embed them in onboarding modules, safety training, and process documentation.
Consultants and system integrators build proposal documents around them. A McKinsey or Deloitte supply chain practice deck without strong visuals just doesn’t compete anymore.
However, if you’re a small warehouse operator with fewer than 50 employees and no plans to automate or present to external stakeholders, these graphics probably aren’t worth the investment right now. A basic facility map and clear written SOPs will serve you better. No judgment, just an honest use-case assessment.
The Bottom Line
Three things stand out after years of working in this space.
First: the best vector automated warehouse graphics aren’t decorative, they’re explanatory. Design them to communicate a process, not just to fill a page.
Second: format matters more than aesthetics. A mediocre SVG that scales perfectly will outperform a stunning JPEG that pixelates on a conference room screen every single time.
Third: this category is growing fast. As warehouse automation investment accelerates globally, the demand for clear visual communication of complex robotic systems is only increasing. Getting your visual assets right now positions you ahead of competitors who are still using stock photos of forklifts to explain AI-driven fulfillment centers.
Whether you’re sourcing assets for a pitch deck or commissioning original illustrations for a system integration proposal, treat your vector automated warehouse graphic as a strategic communication tool. That’s exactly what it is.
Ready to upgrade your warehouse visuals? Start by auditing your current presentation materials. Anywhere you’re explaining an automated process in text alone is an opportunity for a well-designed vector graphic to do that work faster and more memorably.
FAQs About Vector Automated Warehouse Graphics
For maximum flexibility, request both SVG and EPS formats. SVG works natively in web browsers and design tools. EPS handles professional print applications. AI (Adobe Illustrator) files are ideal if your team uses Adobe Creative Cloud.
Yes, in most cases. Standard commercial licenses from Adobe Stock, Shutterstock, or iStock permit color, text, and compositional edits for business use. Always read the license terms, particularly around sublicensing and redistribution.
Custom work from a specialized logistics illustrator ranges from $300 to $2,500 per scene depending on complexity and usage rights. Platforms like Dribbble and Behance are good places to find illustrators who specialize in industrial and supply chain visualization.
Sometimes. Sites like Freepik and Vecteezy offer decent options with attribution requirements. For client-facing materials, investor presentations, or brand collateral, the quality and licensing certainty of paid assets is generally worth it.
Isometric vectors show a three-dimensional perspective from a consistent 30-degree angle, giving depth without true 3D rendering. They're popular for facility overviews. Flat-style vectors are two-dimensional and work better for process diagrams, icons, and user interface elements.
Include: the specific automation technologies to depict (AMRs, conveyors, GTP systems), your facility's approximate scale and flow direction, brand color codes, intended use (print vs. digital), and examples of styles you admire. The more context you provide, the fewer revision rounds you'll need.